UEA
ENV
CRU
Homepage
Data
CRU links
CRU staff
CRU data
Keith Briffa
External links
InterpretingCC
Norwich weather
Foulsham
Homepage
NAO
The IPCC AR4 "Palaeoclimate" chapter
The data that we provide here are now also available from the World Data Center for Paleoclimatology.
Keith Briffa was a Lead Author and Tim Osborn was a Contributing Author to Chapter 6 ("Palaeoclimate") of the Contribution of Working Group I to the Fourth Assessment Report ("AR4" for short) of the Intergovernmental Panel on Climate Change (IPCC), published in 2007.
The report is available online here. The full reference for Chapter 6 is:
- Jansen E, J Overpeck, KR Briffa, J-C Duplessy, F Joos, V Masson-Delmotte, D Olago, B Otto-Bliesner, WR Peltier, S Rahmstorf, R Ramesh, D Raynaud, D Rind, O Solomina, R Villalba and D Zhang (2007) Palaeoclimate. In Climate change 2007: the physical science basis. Contribution of Working Group I to the Fourth Assessment Report of the Intergovernmental Panel on Climate Change, Solomon S, D Qin, M Manning, Z Chen, M Marquis, KB Averyt, M Tignor and HL Miller (eds.). Cambridge University Press, Cambridge, United Kingdom and New York, NY, USA.
In particular, we helped with the drafting of six of the figures that appeared in that chapter, and this webpage provides the data that were used for constructing some of these figures.
-
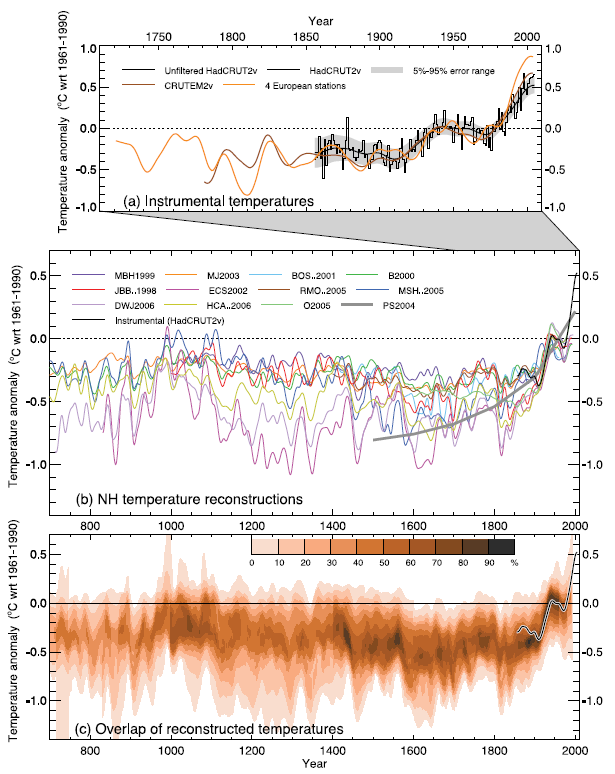
Figure 6.10. Records of NH temperature variation during the last 1.3 kyr...
-
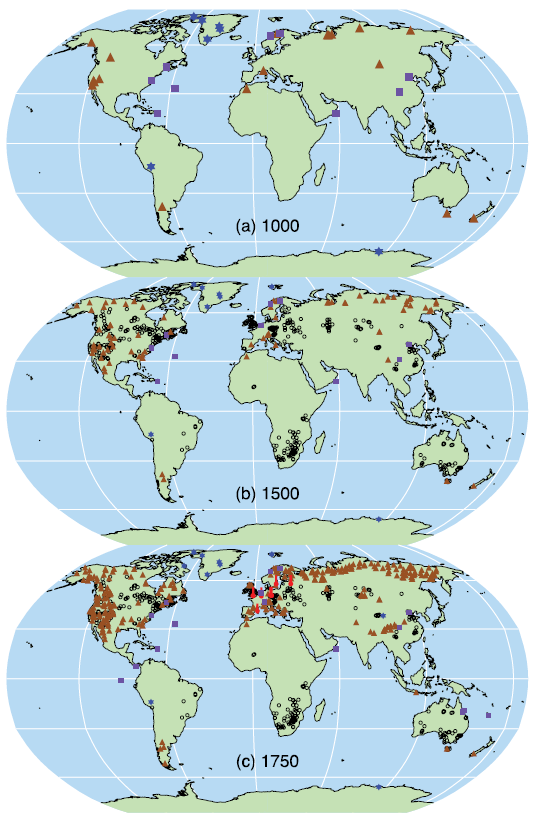
Figure 6.11. Locations of proxy records with data back to AD 1000, 1500 and 1750...
-
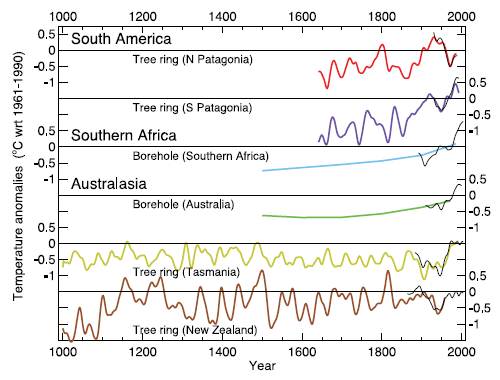
Figure 6.12. Temperature reconstructions for regions in the SH...
-
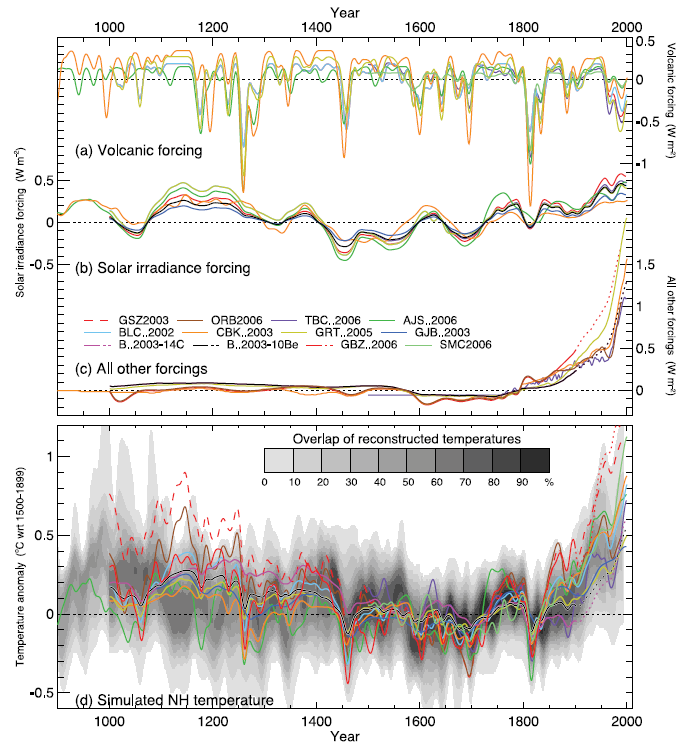
Figure 6.13. Radiative forcings and simulated temperatures during the last 1.1 kyr...
-
Figure 6.14. Simulated temperatures during the last 1 kyr with and without
anthropogenic foricng...
-
Box 6.4, Figure 1. The heterogeneous nature of climate during the 'Medieval
Warm Period'...
Figure 6.10. Records of NH temperature variation during the last 1.3 kyr...
|
Figure (click to enlarge) |
Caption | Data |
|---|---|---|
|
Figure 6.10. Records of NH temperature variation during the last 1.3 kyr. (a) Annual mean instrumental temperature records, identified in Table 6.1. (b) Reconstructions using multiple climate proxy records, identified in Table 6.1, including three records (JBB..1998, MBH..1999 and BOS..2001) shown in the TAR, and the HadCRUT2v instrumental temperature record in black. (c) Overlap of the published multi-decadal time scale uncertainty ranges of all temperature reconstructions identified in Table 6.1 (except for RMO..2005 and PS2004), with temperatures within ±1 standard error (SE) of a reconstruction 'scoring' 10%, and regions within the 5 to 95% range 'scoring' 5% (the maximum 100% is obtained only for temperatures that fall within ±1 SE of all 10 reconstructions). The HadCRUT2v instrumental temperature record is shown in black. All series have been smoothed with a Gaussian-weighted filter to remove fluctuations on time scales less than 30 years; smoothed values are obtained up to both ends of each record by extending the records with the mean of the adjacent existing values. All temperatures represent anomalies (°C) from the 1961 to 1990 mean. |
Data for panels (a) and (b): unsmoothed smoothed (as plotted) Data for panel (c): Reconstruction overlaps, smoothed (as plotted) |
Figure 6.11. Locations of proxy records with data back to AD 1000, 1500 and 1750...
|
Figure (click to enlarge) |
Caption | Data |
|---|---|---|
|
Figure 6.11. Locations of proxy records with data back to AD 1000, 1500 and 1750 (instrumental: red thermometers; tree ring: brown triangles; borehole: black circles; ice core/ice borehole: blue stars; other including low-resolution records: purple squares) that have been used to reconstruct NH or SH temperatures by studies shown in Figure 6.10 (see Table 6.1, excluding O2005) or used to indicate SH regional temperatures (Figure 6.12). |
Data: Proxy location list |
Figure 6.12. Temperature reconstructions for regions in the SH...
|
Figure (click to enlarge) |
Caption | Data |
|---|---|---|
|
Figure 6.12. Temperature reconstructions for regions in the SH: two annual temperature series from South American tree ring data (Villalba et al., 2003); annual temperature estimates from borehole inversions for southern Africa and Australia (Huang et al, 2000); summer temperature series from Tasmania and New Zealand tree ring data (Cook et al., 2000, 2002a). The black curves show summer or annual instrumental temperatures for each region. All tree ring and instrumental series were smoothed with a 25-year filter and represent anomalies (°C) from the 1961 to 1990 mean (indicated by the horizontal lines). |
Data: unsmoothed smoothed (as plotted) |
Figure 6.13. Radiative forcings and simulated temperatures during the last 1.1 kyr...
|
Figure (click to enlarge) |
Caption | Data |
|---|---|---|
|
Figure 6.13. Radiative forcings and simulated temperatures during the last 1.1 kyr. Global mean radiative forcing (W/m^2) used to drive climate model simulations due to (a) volcanic activity, (b) solar irradiance variations and (c) all other forcings (which vary between models, but always include greenhouse gases, and, except for those with dotted lines after 1900, tropospheric sulphate aerosols). (d) Annual mean NH temperature (°C) simulated under the range of forcings shown in (a) to (c), compared with the concentration of overlapping NH temperature reconstructions (shown by grey shading, modified from Figure 6.10c to account for the 1500 to 1899 reference period used here). All forcings and temperatures are expressed as anomalies from their 1500 to 1899 means and then smoothed with a Gaussian-weighted filter to remove fluctuations on time scales less than 30 years; smoothed values are obtained up to both ends of each record by extending the records with the mean of the adjacent existing values. The individual series are identified in Table 6.2. |
Data: unsmoothed smoothed (as plotted) panel (d) shading (smoothed, as plotted) |
Figure 6.14. Simulated temperatures during the last 1 kyr with and without anthropogenic foricng...
|
Figure (click to enlarge) |
Caption | Data |
|---|---|---|

|
Figure 6.14. Simulated temperatures during the last 1 kyr with and without anthropogenic forcing, and also with weak or strong solar irradiance variations. Global mean radiative forcing (W/m^2) used to drive climate model simulations due to (a) volcanic activity, (b) strong (blue) and weak (brown) solar irradiance variations, and (c) all other forcings, including greenhouse gases and tropospheric sulphate aerosols (the thin flat line after 1765 indicates the fixed anthropogenic forcing used in the 'Nat' simulations). (d) Annual mean NH temperature (°C) simulated by three climate models under the forcings shown in (a) to (c), compared with the concentration of overlapping NH temperature reconstructions (shown by grey shading, modified from Figure 6.10c to account for the 1500 to 1899 reference period used here). 'All' (thick lines) used anthropogenic and natural forcings; 'Nat' (thin lines) used only natural forcings. All forcings and temperatures are expressed as anomalies from their 1500 to 1899 means; the temperatures were then smoothed with a Gaussian-weighted filter to remove fluctuations on time scales less than 30 years. Note the different vertical scale used for the volcanic forcing compared with the other forcings. The individual series are identified in Table 6.3. |
Data: unsmoothed smoothed (as plotted) panel (d) shading (smoothed, as plotted) |
Box 6.4, Figure 1. The heterogeneous nature of climate during the 'Medieval Warm Period'...
|
Figure (click to enlarge) |
Caption | Data |
|---|---|---|
|
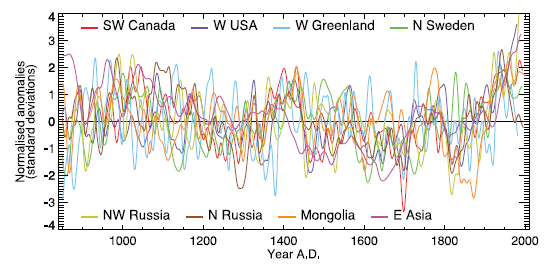
Box 6.4, Figure 1. The heterogeneous nature of climate during the 'Medieval Warm Period' is illustrated by the wide spread of values exhibited by the individual records that have been used to reconstruct NH mean temperature. These consist of individual, or small regional averages of, proxy records collated from those used by Mann and Jones (2003), Esper et al. (2002) and Luckman and Wilson (2005), but exclude shorter series or those with no evidence of sensitivity to local temperature. These records have not been calibrated here, but each has been smoothed with a 20-year filter and scaled to have zero mean and unit standard deviation over the period 1001 to 1980. |
Data: smoothed (as plotted) |